Application Performance
Tracing Application Performance With AWS X-Ray
The TripSearch, HotelSpecials and FlightSpecials Lambda functions each contain the necessary dependencies to support emitting tracing events to AWS X-ray, to allow you to easily trace the calls between the components of your distributed system. In this exercise, you will enable the feature and review the AWS X-ray console.
- In the AWS Lambda Console, click on the Lambda function idevelopTripSearchFull. Select the Configuration tab then select the Monitoring and operations tools panel. Click the Edit button then enable the Active tracing in the AWS X-Ray section. Click Save.


- Switch over to the TravelBuddy SPA webpage that you have hosted in the S3 bucket. Sign in to the application if you are not already signed in.
- Click the Go! button without any text entered, to invoke the idevelopTripSearchFull Lambda function. It will take a moment to complete because you have changed the configuration for the Lambda function so it will be a cold start.

- After the dialog is shown displaying the trips, switch back to the AWS console, select Services and type
X-ray. Click the X-ray item in the list to open the AWS X-ray console. - In the AWS X-Ray page, click Get started then click Cancel.

- Select the Service map on the navigation panel.
- You will see a Service map that looks similar to this:

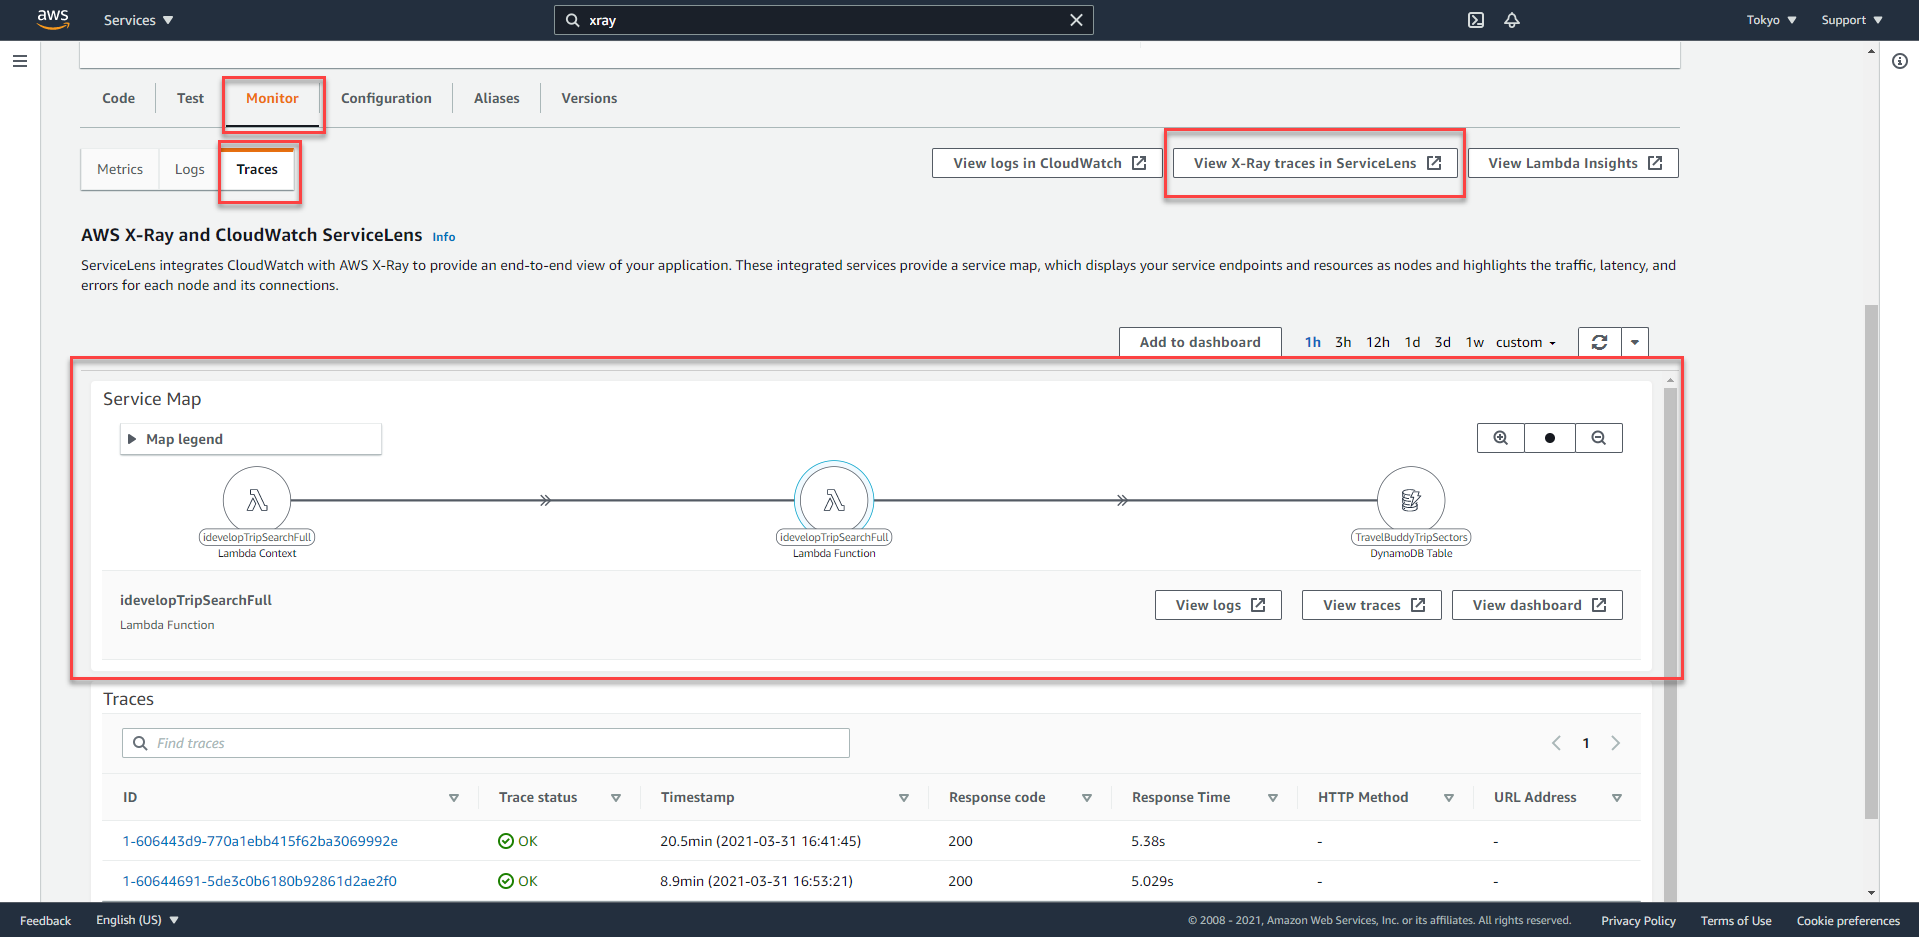 You can now also see the service map directly from Lambda console.
- Click the first green circle which indicates the call into the Lambda function. The Details panel will appear. This panel shows information such as the response distribution histogram where you can easily see what percentage of calls are taking various amounts of time to execute.

- Click View Traces, this is at the bottom of the Service details which just showed up.
- In the Traces list click the link for the first item
- The Traces details panel will appear. You will be able to see a timeline view of the various actions and their execution durations, such as:

Here, you can see that the overall call took 5 sec, 1.3 sec of which was taken by the scan of the TravelBuddyTripSectors DynamoDB table.
- Enable active tracing on the other Lambda functions that have been created as part of this lab: idevelopTripSearchFull, idevelopTripSearchFromCity, idevelopTripSearchToCity and GetHotelSpecials. You can do this manually using the console. However, note that the function created through automation with a name starting with awscodestar will have its configuration overwritten if you re-deploy the code.
See the next Challenge Exercise to address this.