Tracing Application Performance With AWS X-Ray
Tracing Application Performance With AWS X-Ray
The TripSearch, HotelSpecials and FlightSpecials Lambda functions each contain the necessary dependencies to support emitting tracing events to AWS X-ray, to allow you to easily trace the calls between the components of your distributed system. In this exercise, you will enable the feature and review the AWS X-ray console.
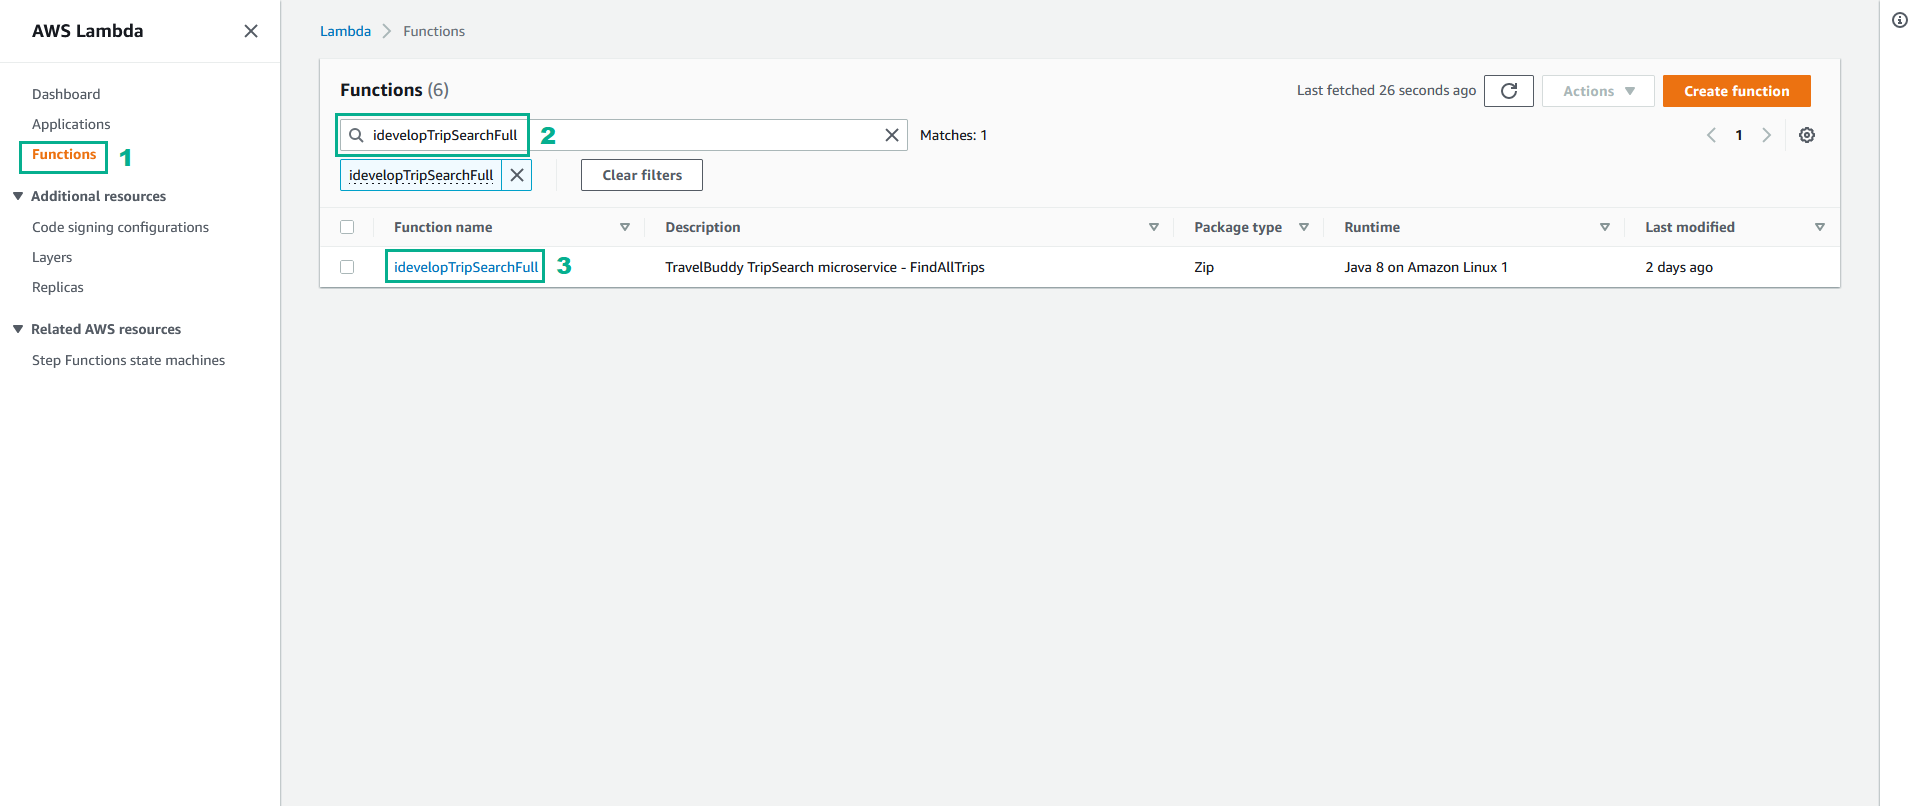
- Go to AWS Lambda console.
- Click Functions.
- Type idevelopTripSearchFull to the search bar and press Enter.
- Click idevelopTripSearchFull.
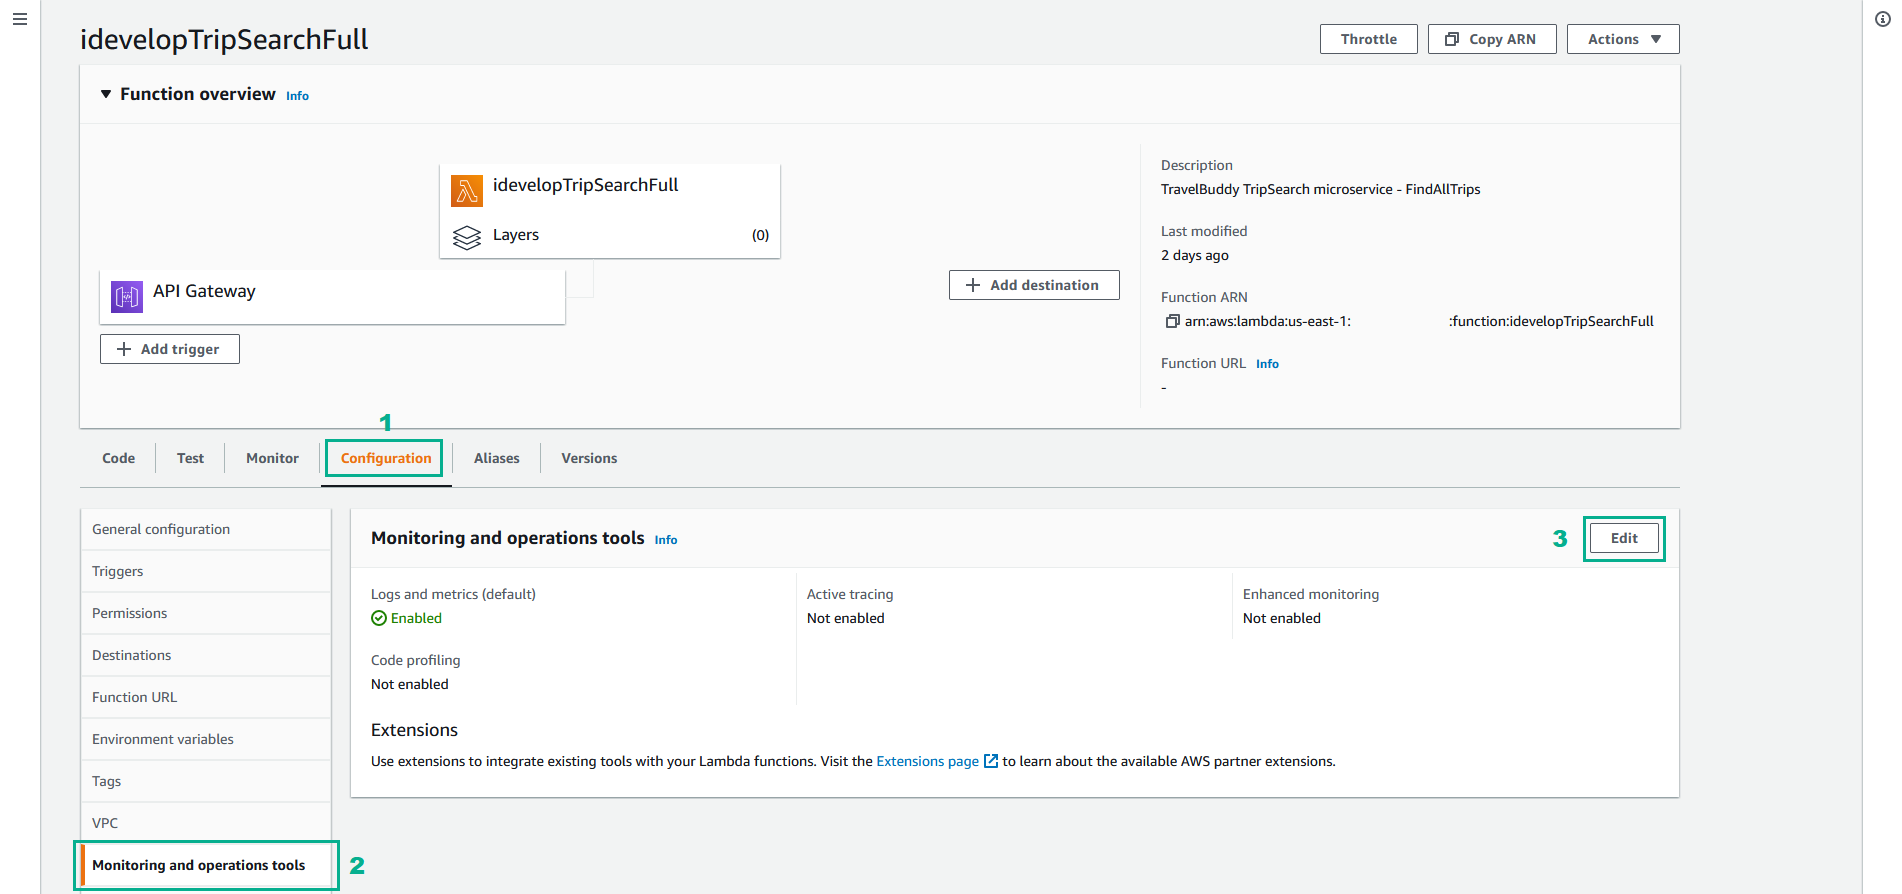
- Click Configuration
- Click Monitoring and operations tools
- Click Edit
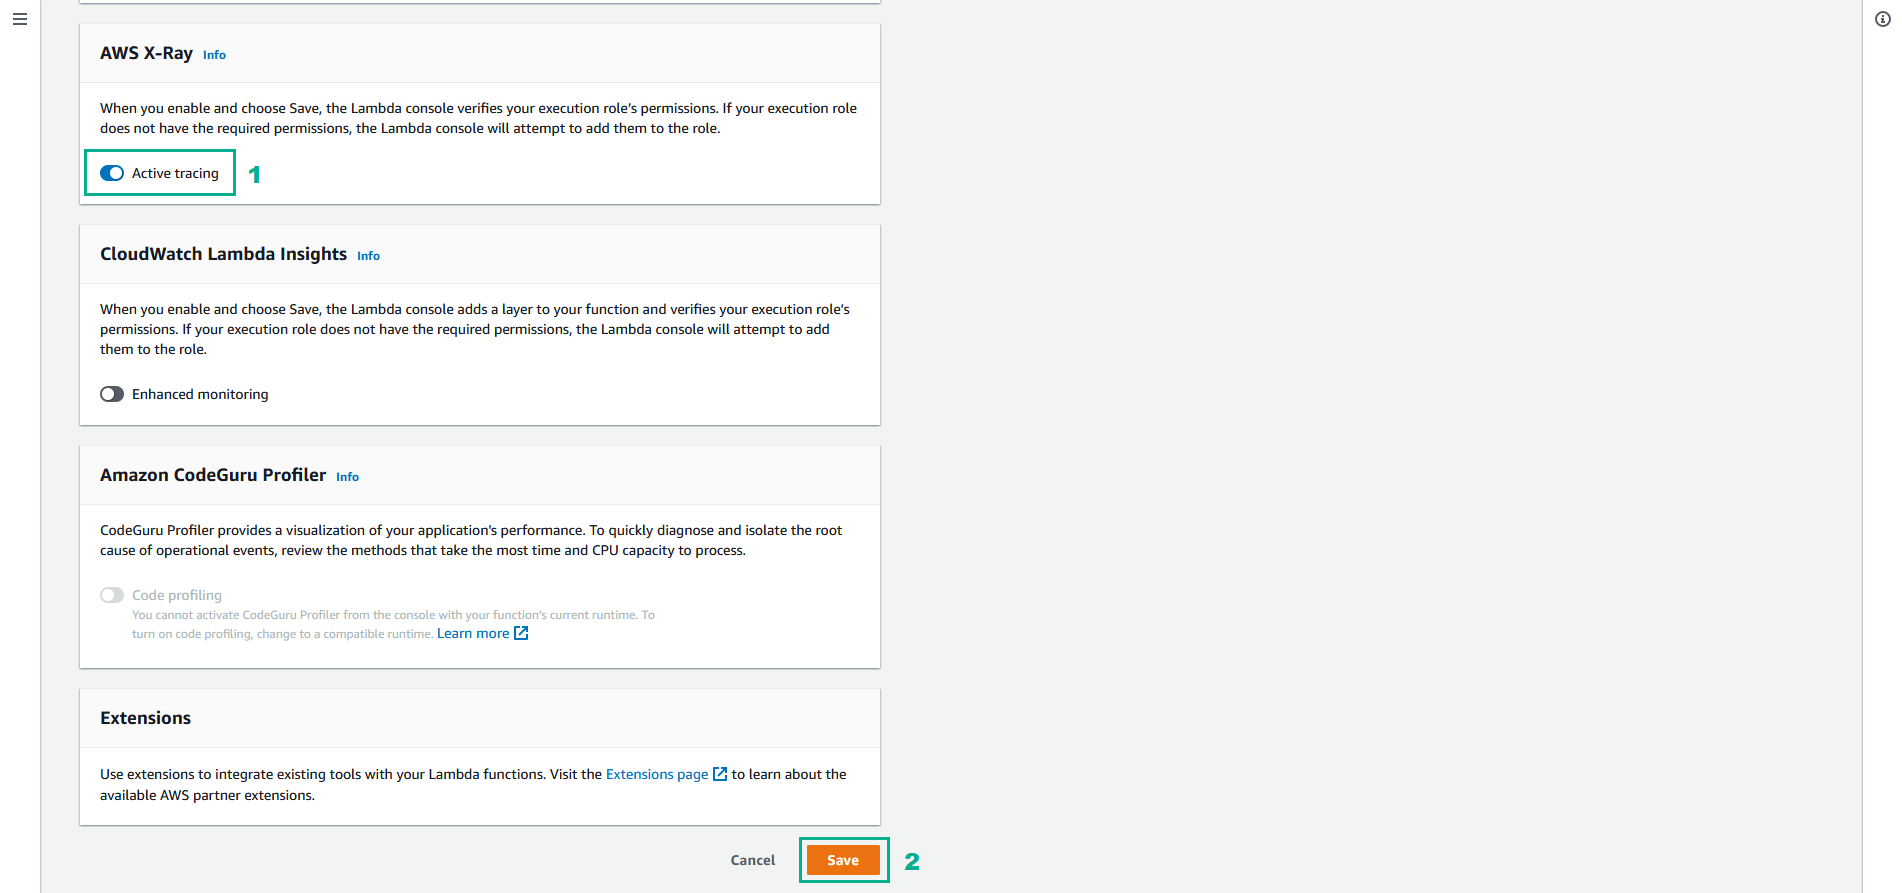
- In the AWS X-Ray section, enable the Active tracing
- Click Save
- Go to the TravelBuddy SPA page.
- Sign in to the application if you are not already signed in.
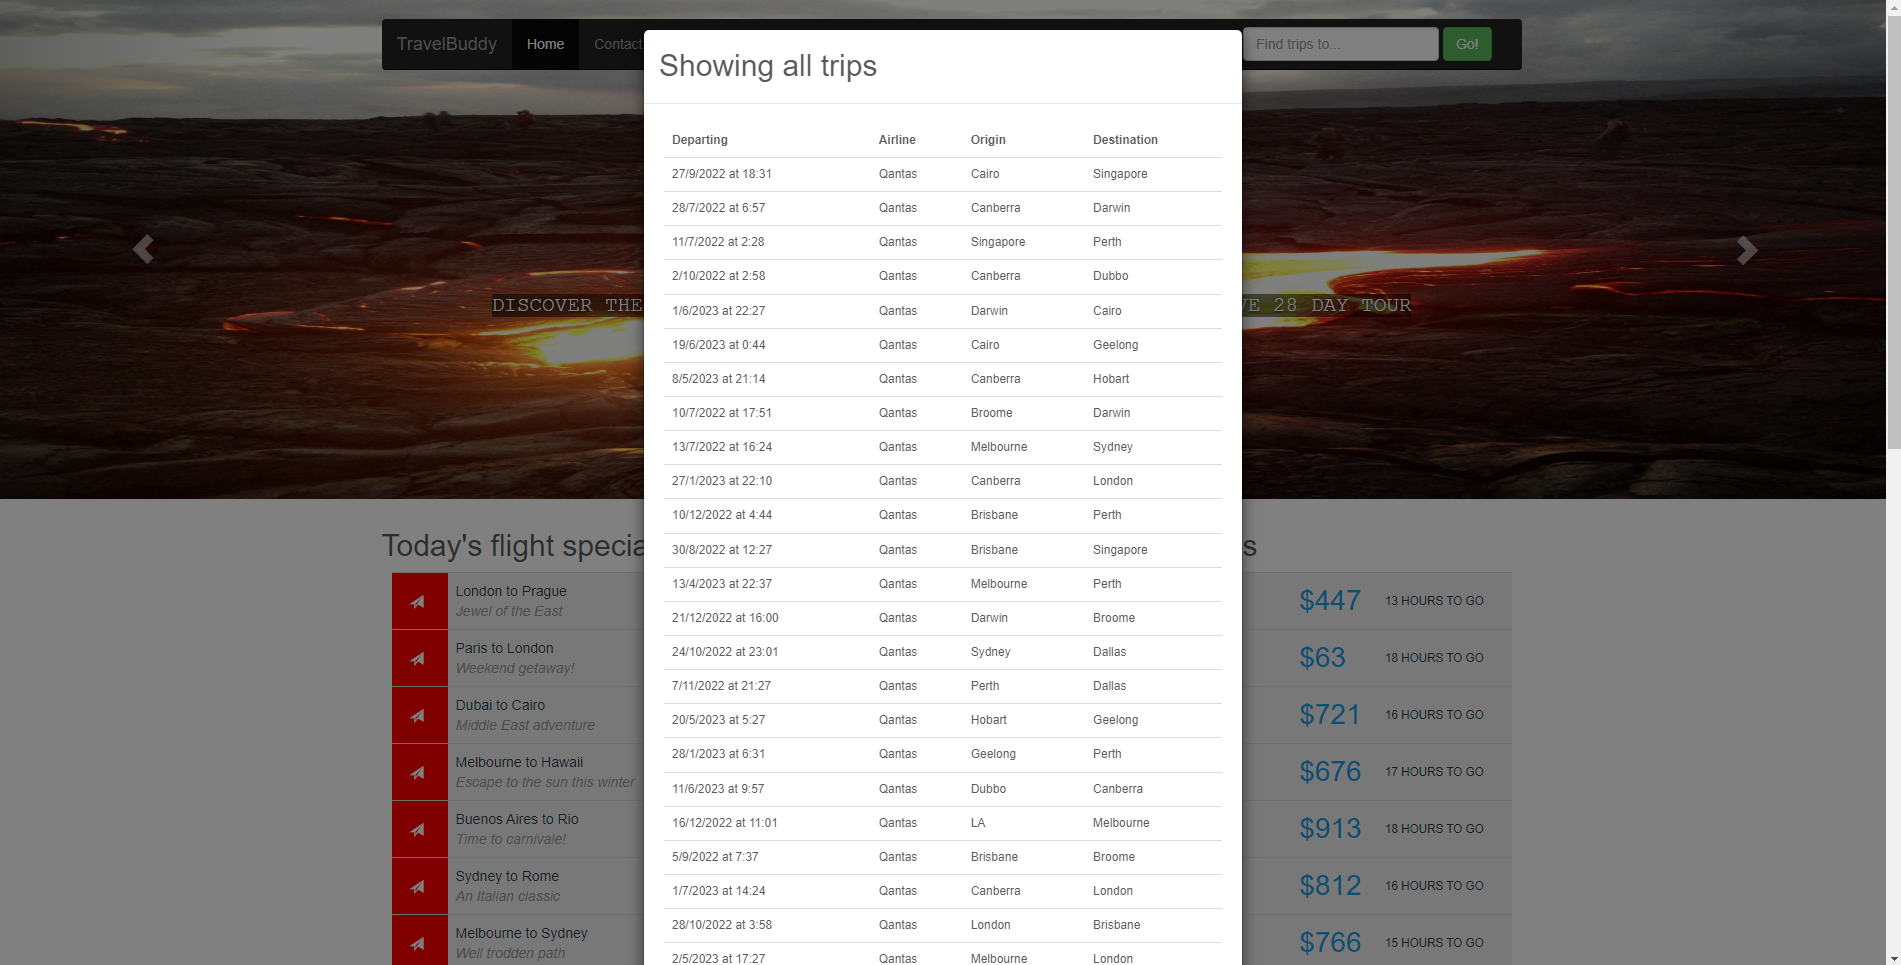
- Click Go! button without any text entered, to invoke the idevelopTripSearchFull Lambda function. It will take a moment to complete.
- the dialog is shown displaying the trips.
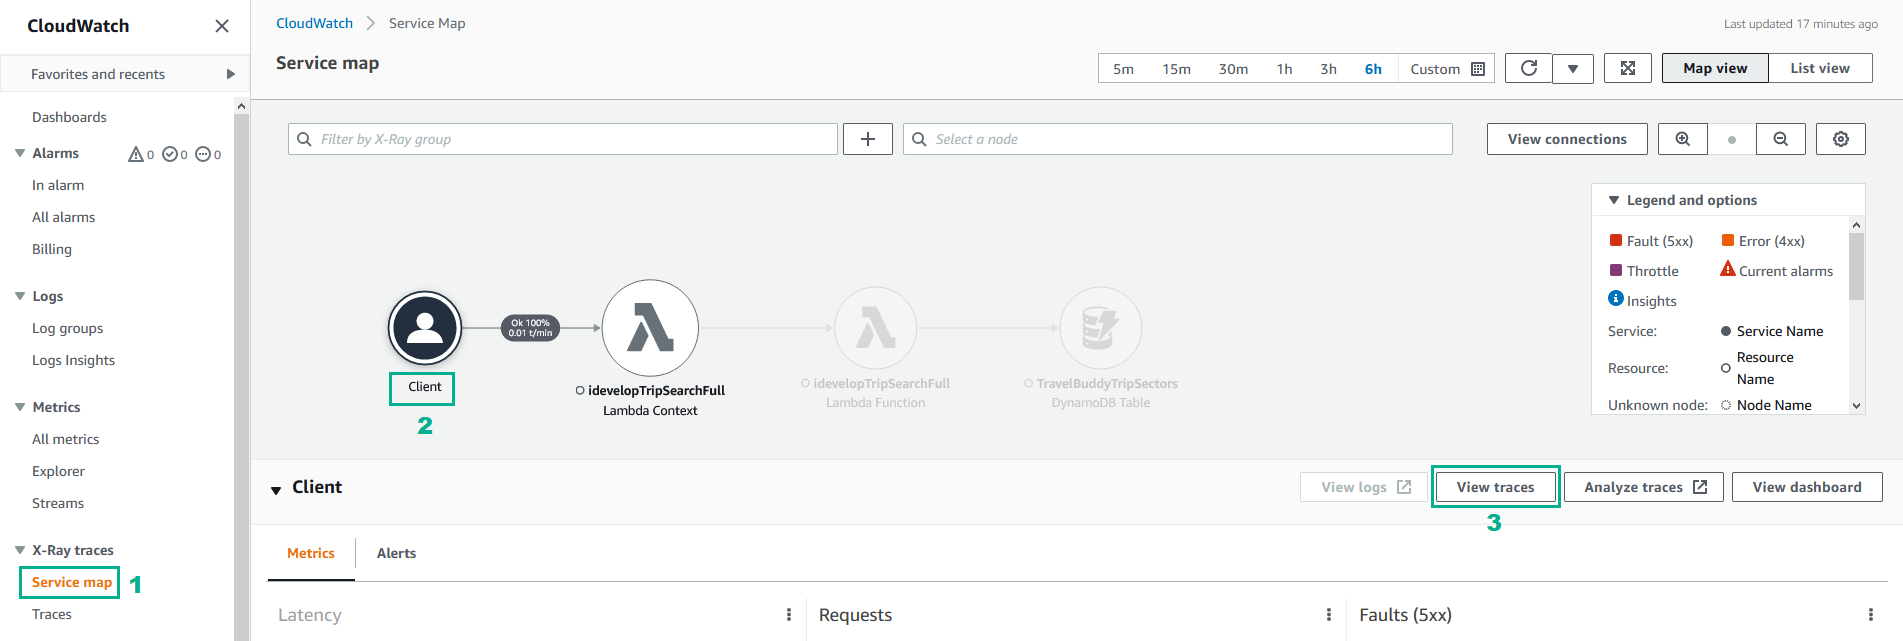
- Go to AWS CloudWatch Console.
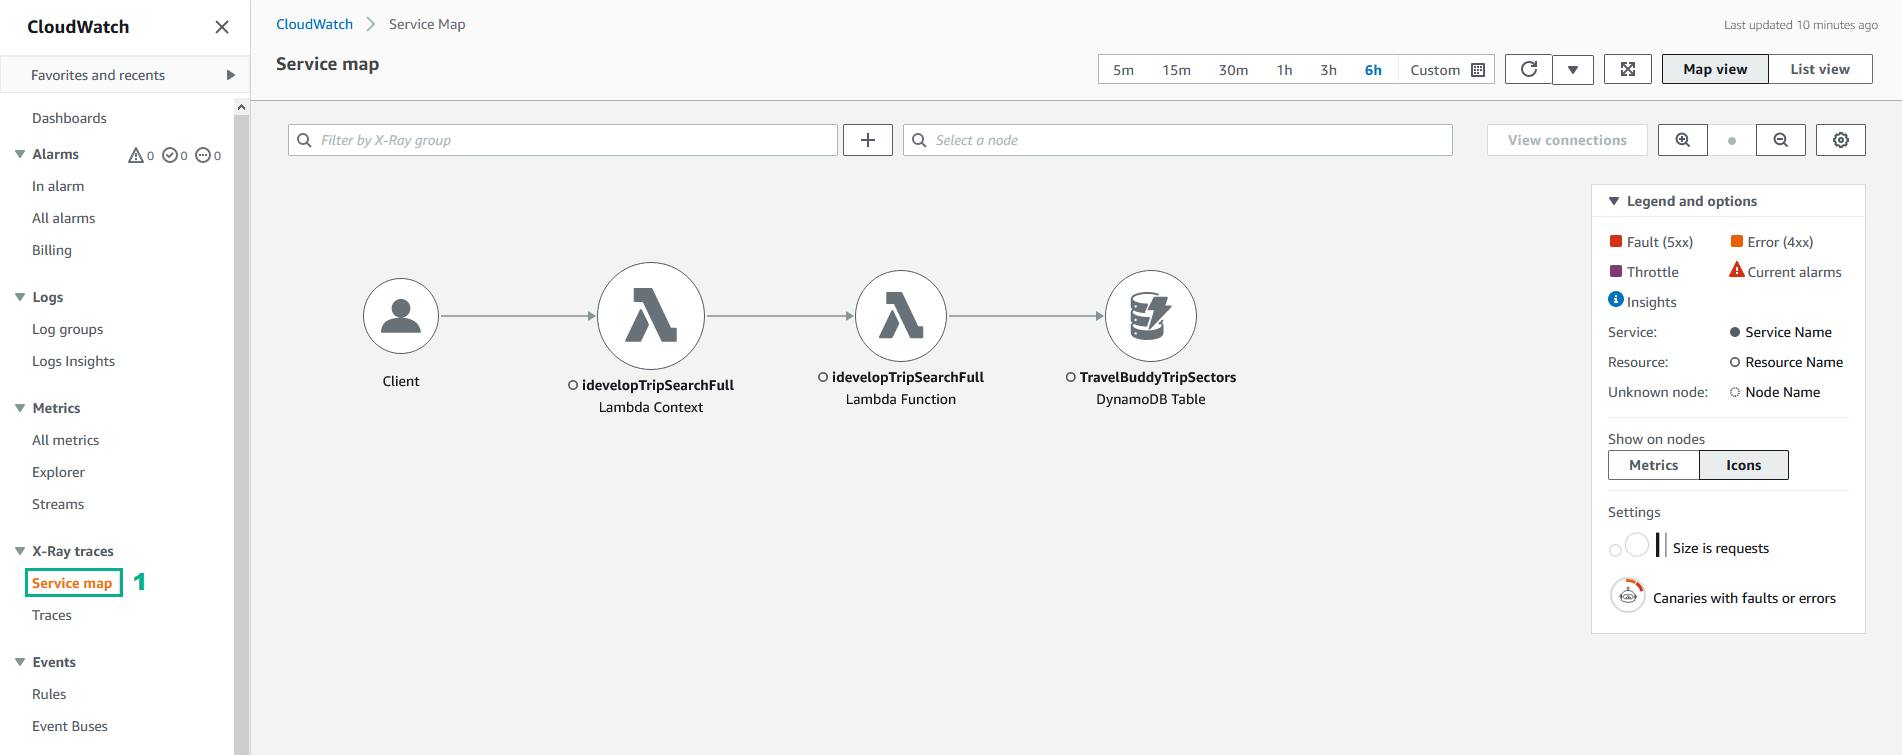
- Open X-Ray traces.
- Click Service map
- Open Legend and options
- Click Metrics
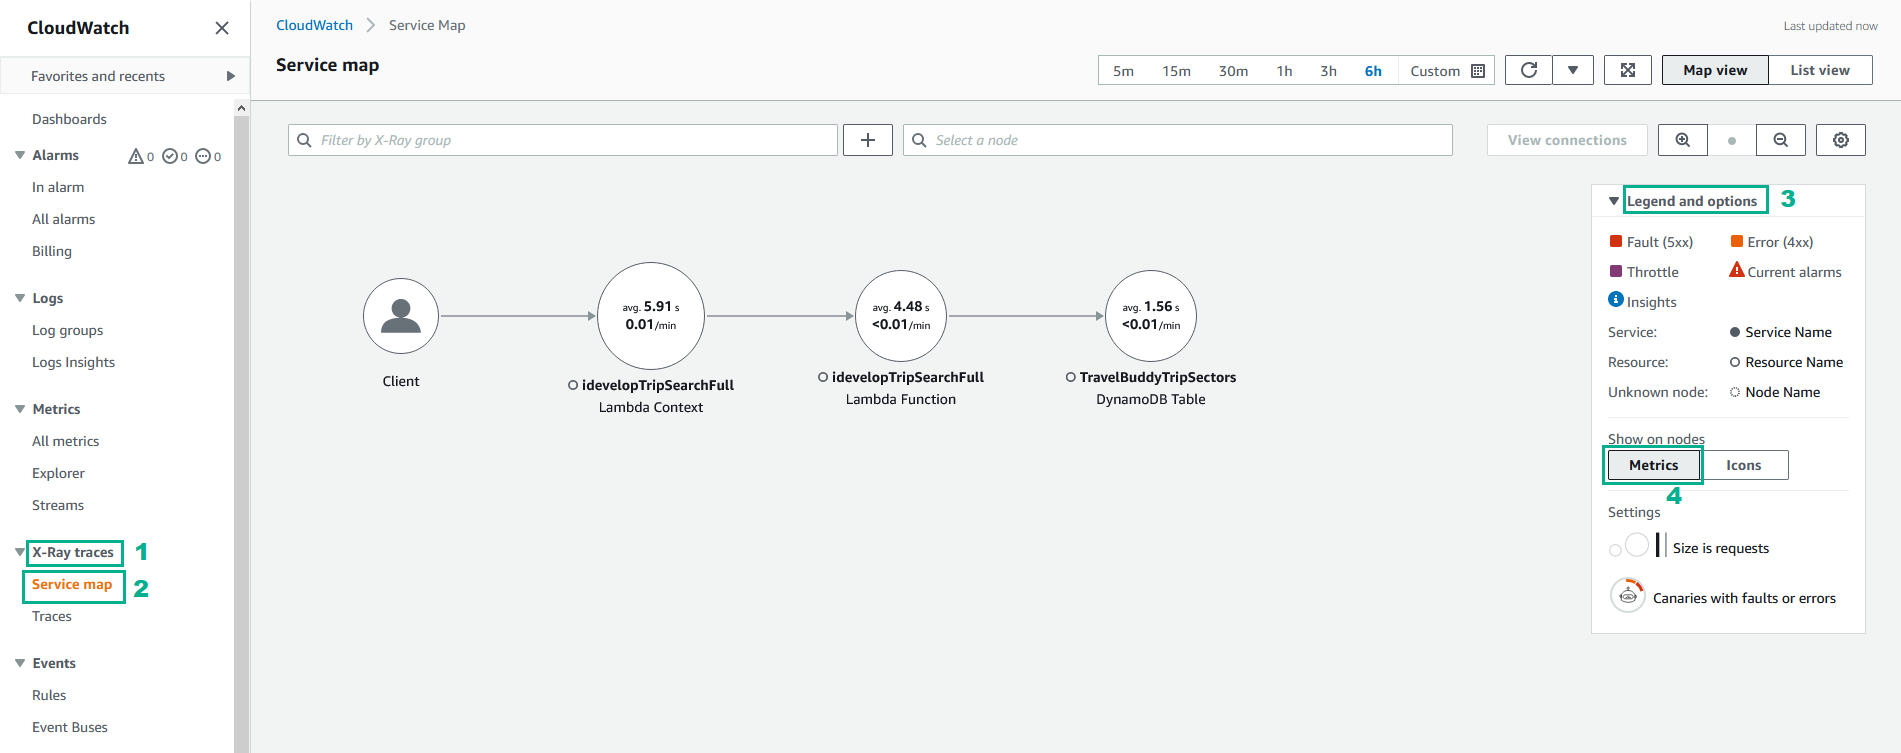
- Click Service map, you will see Service map.
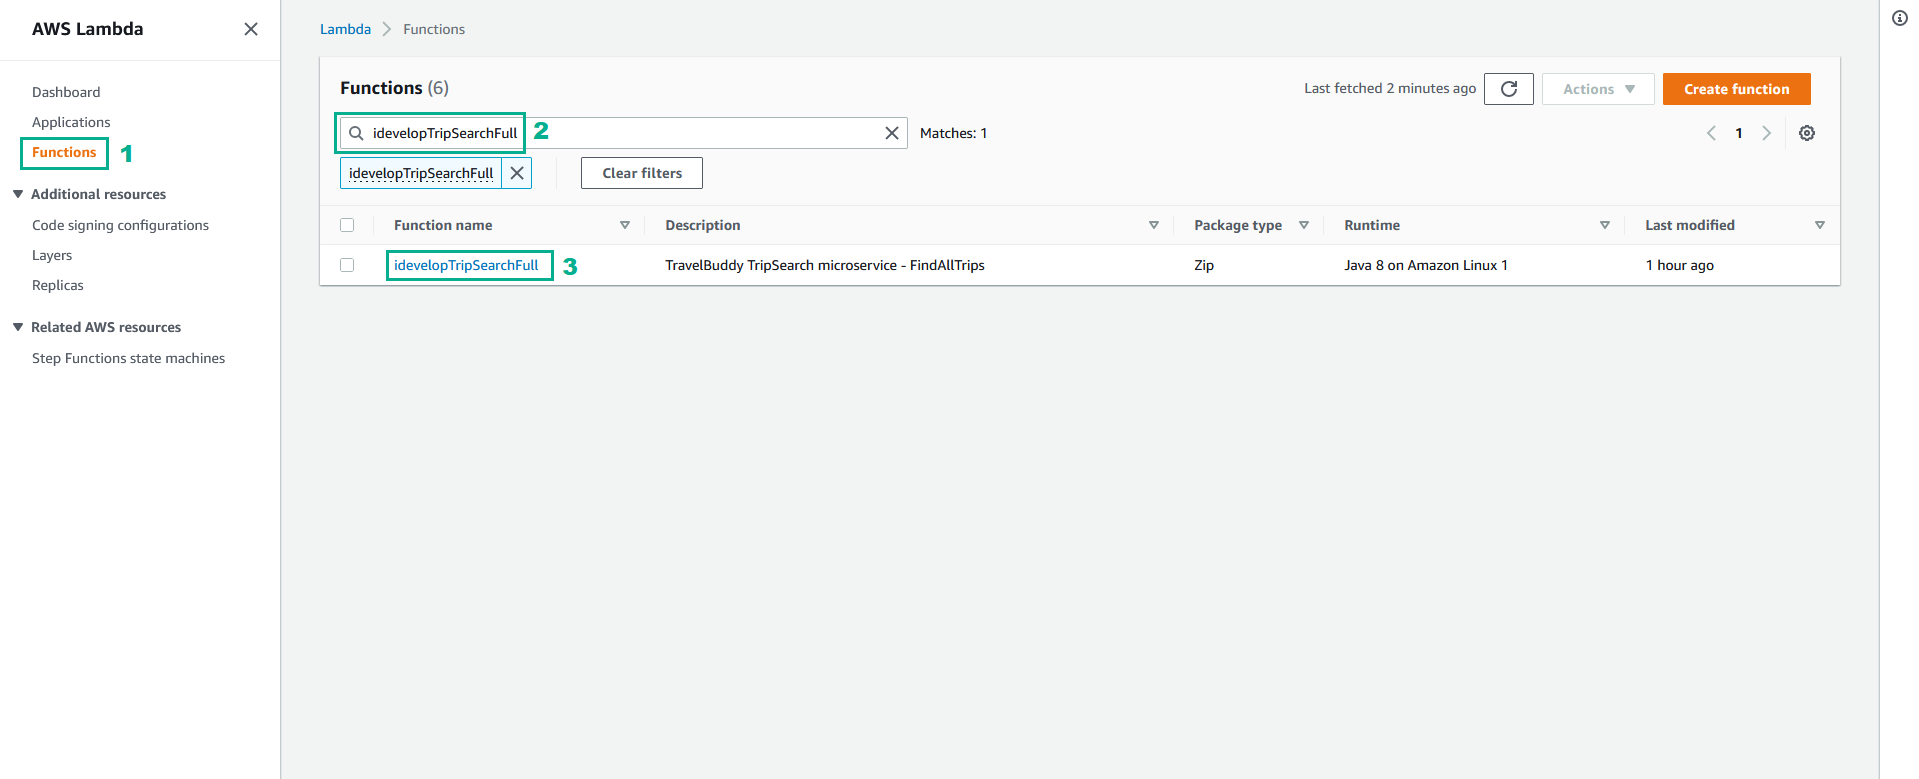
- Go to AWS Lambda console.
- Click Functions.
- Type idevelopTripSearchFull to the search bar and press Enter.
- Click idevelopTripSearchFull.
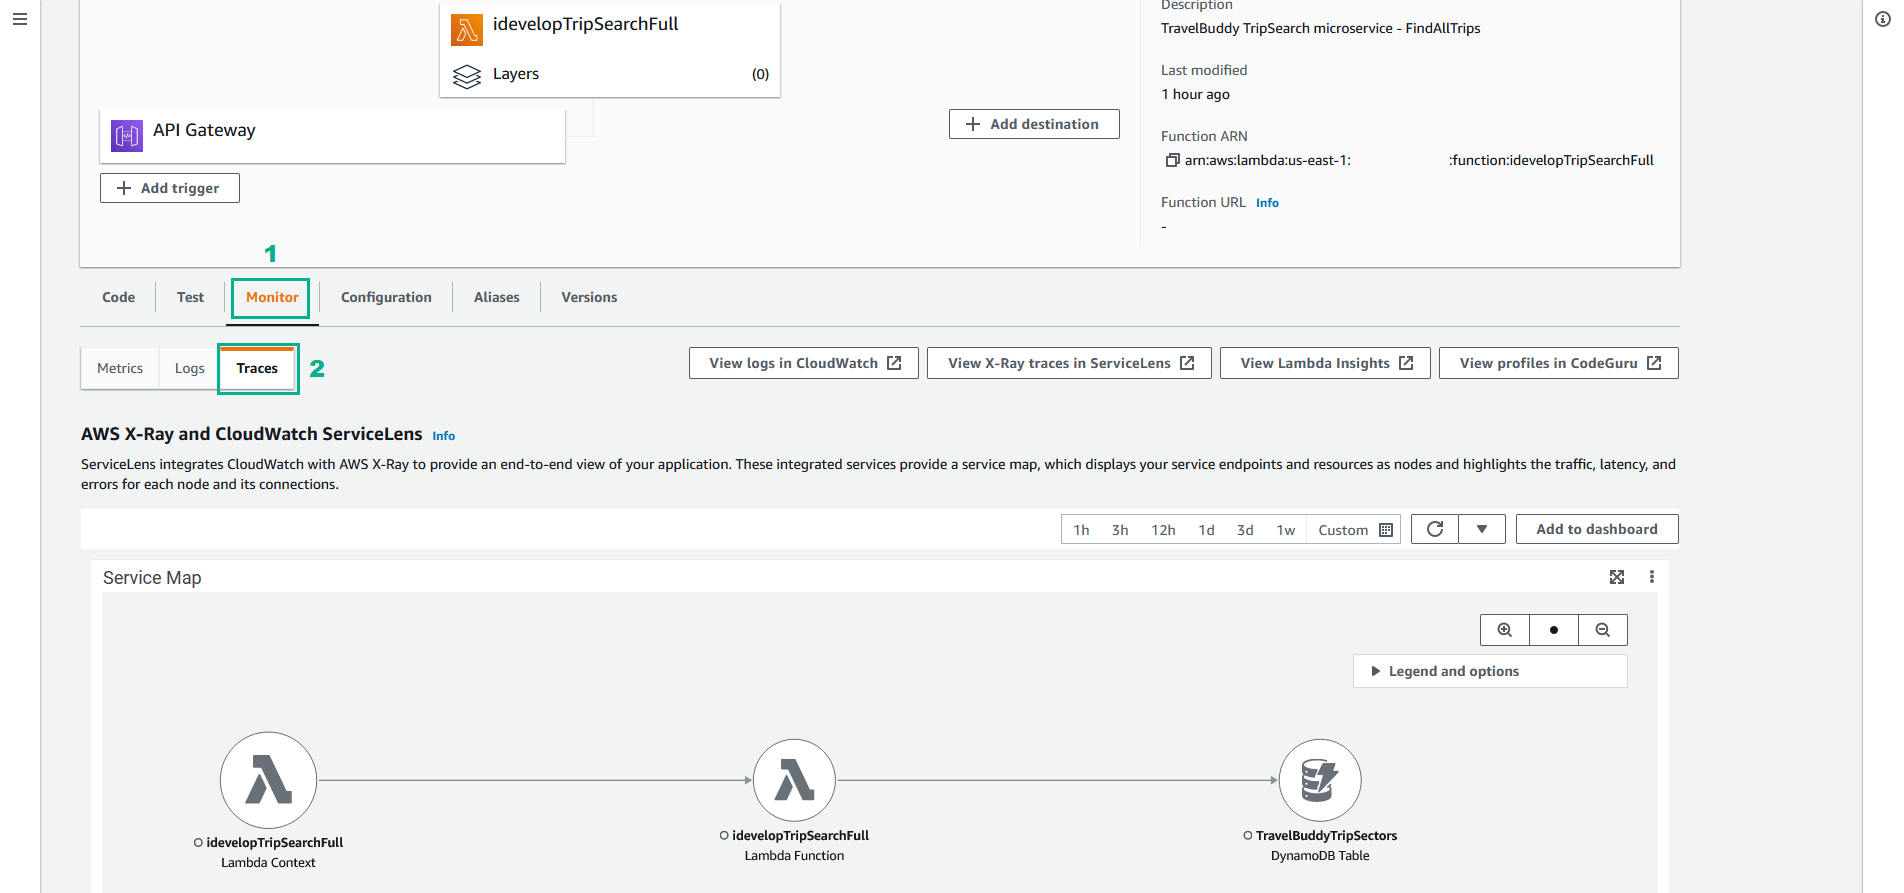
- Click Monitor
- Click Traces
- You can now also see the service map directly from Lambda console.
- Back to the AWS CloudWatch Console.
- Click Service map
- Click Client
- Click View traces
- In the In the Traces list, click the ID of the the first item
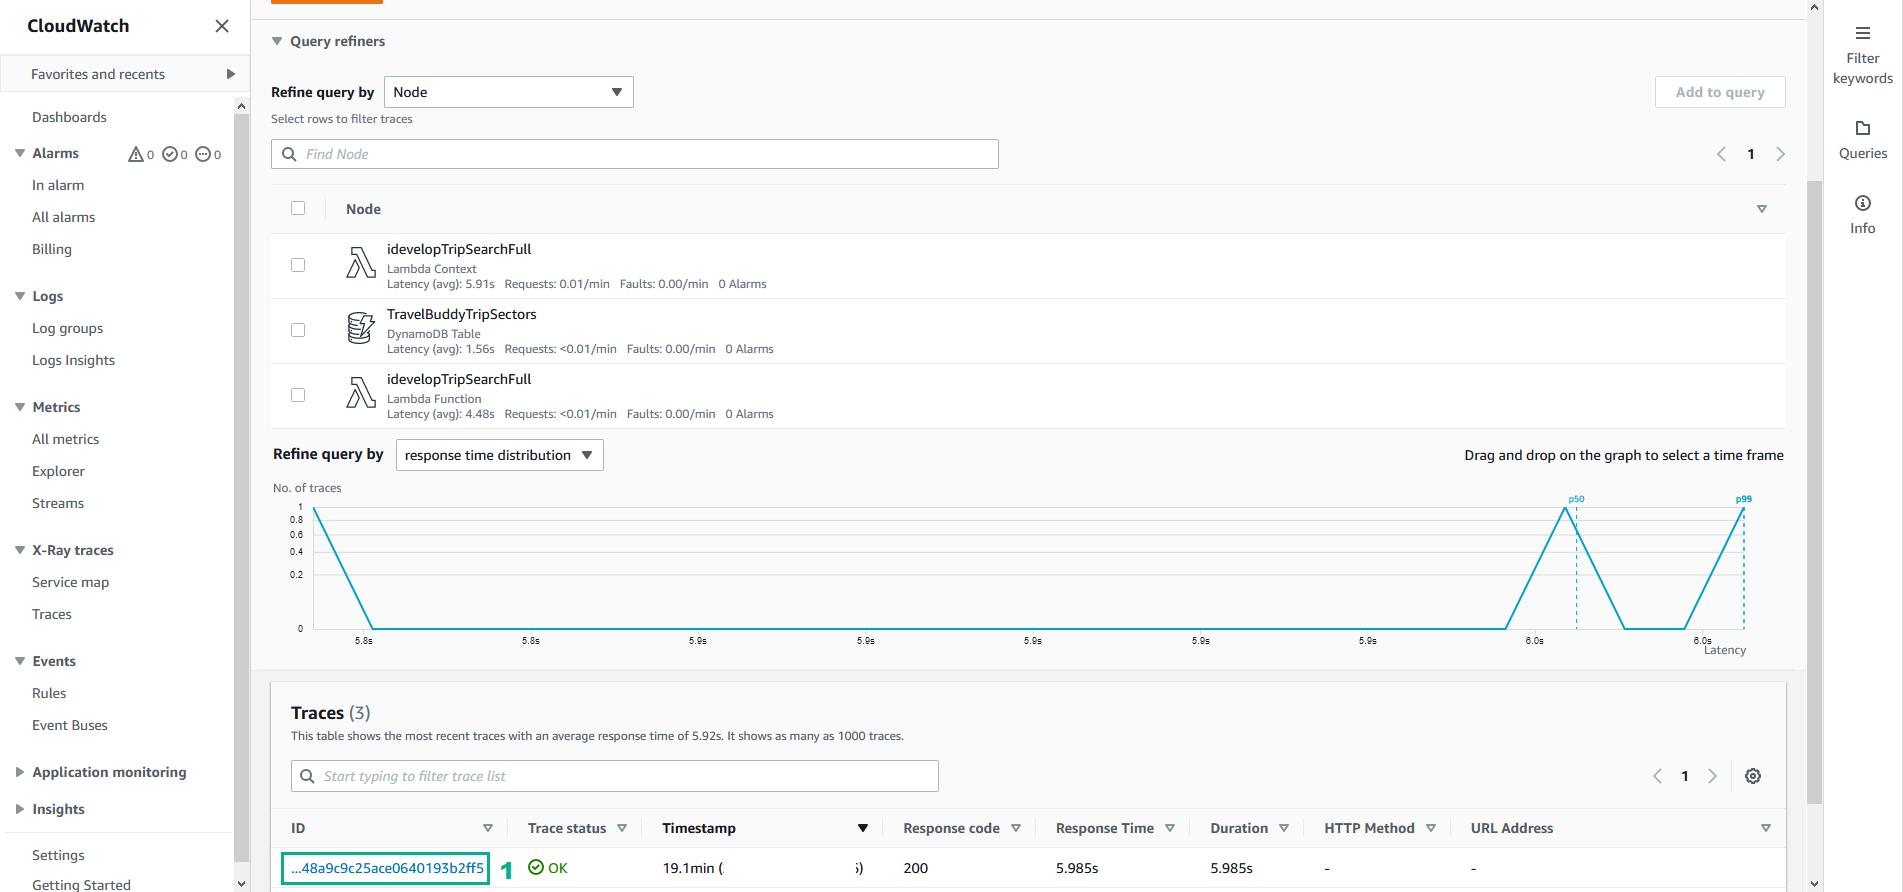
- You will be able to see a timeline view of the various actions and their execution durations
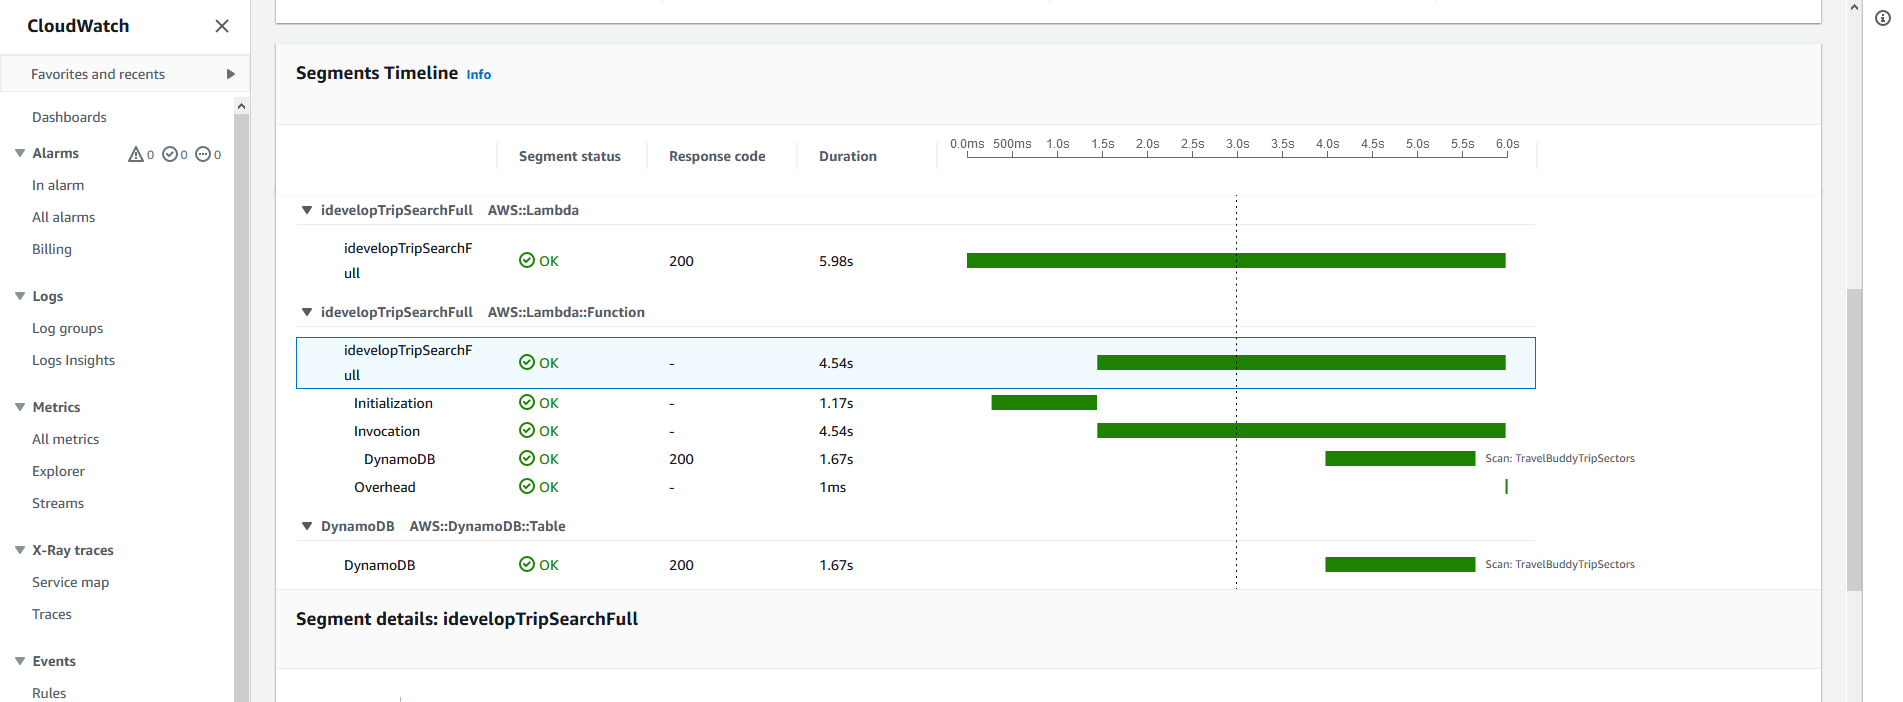
Here, you can see that the overall call took 5,98s, 1.67s of which was taken by the scan of the TravelBuddyTripSectors DynamoDB table.
Enable active tracing on the other Lambda functions that have been created as part of this lab: idevelopTripSearchFull, idevelopTripSearchFromCity, idevelopTripSearchToCity and GetHotelSpecials. You can do this manually using the console. However, note that the function created through automation with a name starting with awscodestar will have its configuration overwritten if you re-deploy the code